DashboardLess : The future of the dashboard is here
A dashboard is a visual display of important information needed to be consolidated and arranged on a single screen so the information can be represented at a glance in a pictorial format for easy comparison or fact findings
Dashboards are integral part of any software solution running to find stuff like orders to date to giving spread of errors across the system or maybe an performance index , there is no such thing as typical dashboards its always something dear to the organisation and each has limits only to creativity and as far as statistic computations go.
No matter how much we fuss about data today, let’s face it, it has always been there , it just multiplied by many folds. The term big data is relatively new , if we think in a tech perspective the same data-store just got larger, but its just not data even the technology for finding reading data has improved by large strides. What has changed, though, is the speed at which data multiplies. The 3Vs of big data, namely volume, variety, and velocity, are changing at such a rapid pace that most businesses simply don’t know what to do, let alone how to makes sense of it all. Besides the stacks in their repositories, businesses see the growing mountain of data in the form of emails, texts, social data, etc. on a daily basis. It’s messy and chaotic.
It’s all relative.
- A file with a million rows is large for Excel, but not for Pandas
- A file with 100 million rows is large for Pandas, but small for Spark on one machine
- A file with 1 billion rows is large for Spark on one machine but ok for a couple of machines
- And so on
Analysts are actually data curators.
Enter Data Analyst, the wizard of data interprets data and turns it into information that can offer ways to improve a business, thus affecting business decisions. A Data Analyst gathers information from various sources and interprets patterns and trends. Once data has been gathered and interpreted, the Data Analyst reports back what has been found in a comprehensive study to the business or his team most cases be in form of mighty 'ol Dashboard.
But dashboards have inherent problem they’re built with boundaries in mind.Its always like ask me the right questions and I have the right answers , but on the same spectrum a modern business intelligence systems are more powerful .It can adapt to varying business in-depth information from the same data heap which also powers the dashboards with limited capabilities, BI as they are termed as have built in machine learning and other analytical insights which typically a dashboard is not an apt place to dive into.This ever changing need of data representation brings in a ton of technical debt.
For example : while a graph display from a excel may work fantastic on small scale but with real querying this will become a single bottleneck throwing multiple locks at your database , driving developers and sysadmins to frenzy.
As a growing company , electrum too faced the same data-choking points, with span of Gbs of data <fill in x customers > , with 30+ partnerships (we grew 5 to 25 in a year) more adding up every quarter both on whitelisting and co-branding our databases have hard time coping up with this demand for every changing dynamics of data representation.
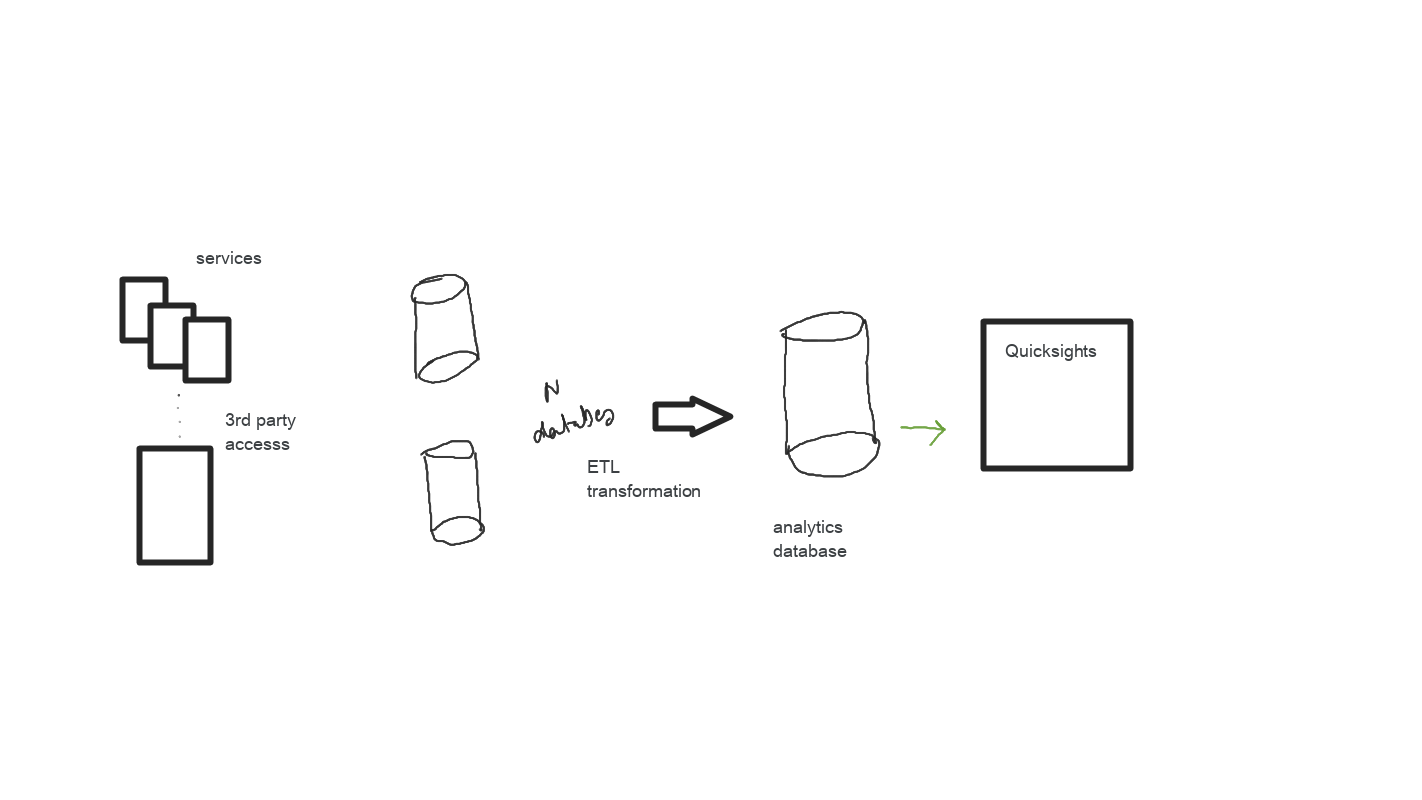
The very first thing we did was moving representation data out of transaction databases , what immediately hit us out that older data needs to be transformed to a new data schema to fit certain model calculation.With ton of control case study and tried every techniques we could google out our sole objective focused on getting data transformed and we soon found our cloud first approach of these processes were very expensive or has a breaking point, even a lot of top notch products in market just broke down randomly and the fix for that pushed us in greater tech debt. By the time we could actually make this migration happen we made a significant change on business front the whole system was built out to have one email as one unique customer with expansions we had to allow same customers in multiple partnerships.Back to square one , the plan for next moves ranged from over engineering to introducing mathematical modelling but somehow or somewhere none was helping us to get optimal results.
Discovery of QuickSight
Interesting problems leads to interesting discoveries !!! we stumbled on this quicksights and it was like the exact solution we were looking into , Analytics needs zero developer touch , Dashboards are embeddable (the only reason I advocated this) , ML-powered BI Service built for the cloud , Data transformation happens at offsite and best part we can connect to multiple data sources using native JDBC , multiple MYSQL databases , and reports gets generated in seconds with full dashboard capabilities like adhoc filters , downloads and responsive :) Armed with the know how from our previous endeavours we knew just what has to be done. It was a natural move after that.
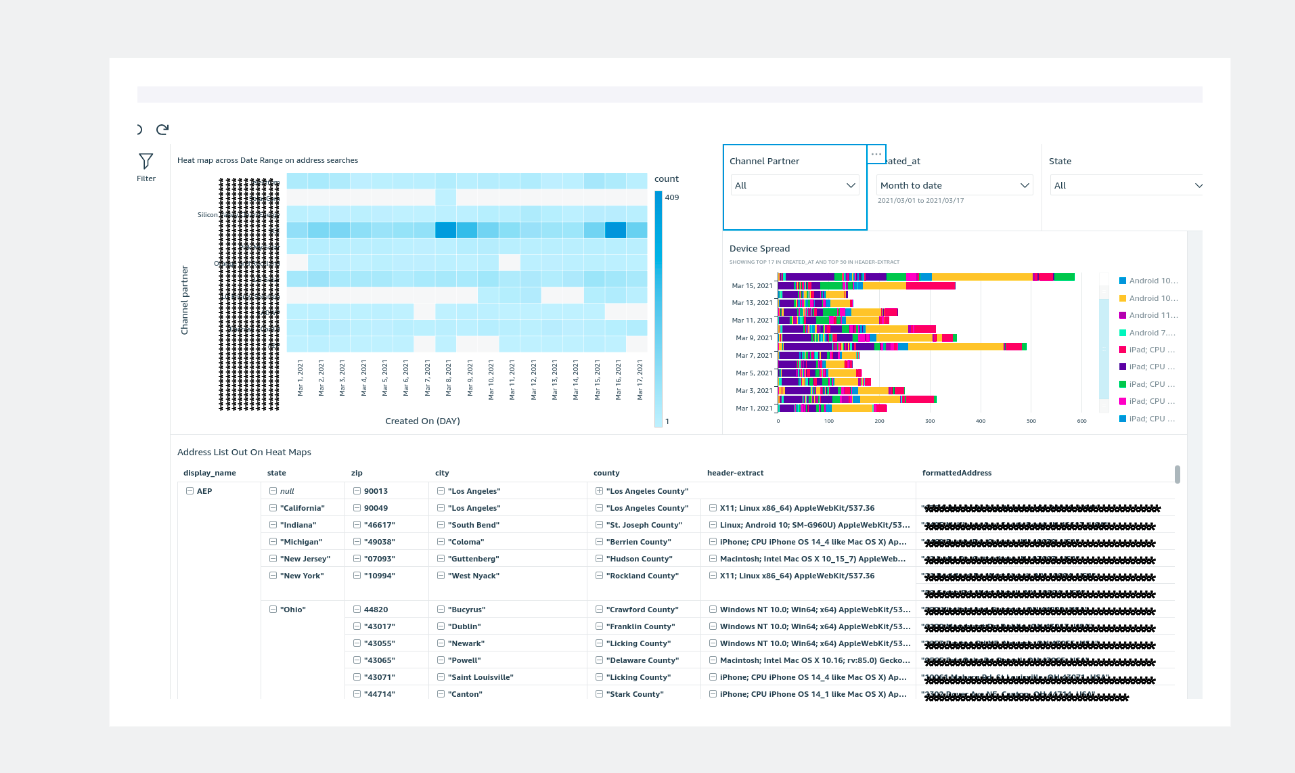
One of our quicksight in action full embedded and with add on adhoc filtration to deep dive , zero touch from dev end, part from getting the right at the analytic database.
Few cost saving tips on Quicksight
- Read data from the single non transaction database.
- Avoid complex internal query rather let Quicksight take care of the flat data set
- Each row needs to be under 2000MB so over complex data will cause significant loading issue bring only the data required.
- Sharing dashboards in quicksights allows multiple user access to the same data , quicksight charges per user per session wise , one way to cost control is to give access to embedded dashboard on a html page behind a secure login.
Quicksights is one of the products in the market which goes fro cloud based analytic platform , there are ton of them yet to be discovered , In our case we have the full infrastructure over AWS , its kind of very easy to stay put in a given environment.
That said, let’s end this blog with some insights from a team who did got crushed under heap of data — with some thoughts on what you can consider:
- Short Life: Consider any newly published dashboard like driving a car off the lot. It drops in value immediately and is outdated . Keep coming back to data so it can be both relevant & have longer life.
- Right Questions: Speak to team and share your vision on how the dashboard is “meant” to be used. Find stake holders & ask them: What do they look for and what they do when they use your dashboard? What’s more meaningful ?
- Consider flow – get developers standpoint of how data flows ? Right from DB's screaming for space to RAMS cramping up last performance juice , developers will tactfully see it happen , a lot of data management can be done right at data ingestion reducing transformation over head. What is the creative flow? What is the critical thought flow? What is the end user flow? Listen, understand & re-imagine
What are your thoughts on this topic? Is dashboardless the new thing? And where do you see the middle ground? let us know in the comments bellow